1. What is the purpose of GIRI?
- The Global Infrastructure Risk Model & Resilience Index (GIRI) is the first-ever fully probabilistic model to identify and estimate risks associated with major geological and climate-related hazards (Earthquake, Tsunami, Landslide, Flood, Tropical Cyclone and Drought) across critical infrastructure sectors (Power, Telecommunications, Roads and Railways, Water and Wastewater, Ports and Airports, Oil and gas, Buildings, Education and Health) for all countries and territories in the world.
- GIRI’s purpose is to improve the understanding and make the global landscape of infrastructure risk and resilience visible. In doing so, GIRI provides a globally comparable set of financial risk metrics such as the Average Annual Loss (AAL) and Probable Maximum Loss (PML) for infrastructure assets.
- GIRI can assist in the identification of the contingent liabilities internalized in each infrastructure sector and the implications for social and economic development in the context of climate change. It can, thus, provide the basis for developing national resilience policies, strategies and plans, and resilience standards.
2. How was risk modelled in GIRI?
- The broad steps in the risk modeling process entailed:
- Hazard input data was obtained by developing comprehensive sets of simulated events accounting for all the possible manifestations of each hazard and providing information about the geographical distribution of the hazard intensities and their frequency of occurrence.
- The intensities and frequency of the hydrometeorological hazards were modified to account for two future scenarios, reflecting a lower and upper bound of climate change. To do this, two scenarios for the year 2100 were used: a conservative one reflecting minimal climate change effects and a more extreme one representing a higher level of carbon emissions. These scenarios align with different pathways defined as Shared Socioeconomic Pathways (SSPs), ranging from SSP1 (minimal emissions) to SSP5 (high emissions), or Representative Concentration Pathways (RCPs), from RCP2.6 (minimal emissions) to RCP8.5 (high emissions). The model also considered existing climate conditions when assessing risk.
- The exposure database was assembled by geolocalizing exposed assets and networks in each infrastructure sector from available public data sources.
- Economic values were assigned to each asset in the exposure database through a detailed process, and the total value of infrastructure assets in each country was adjusted to reflect their capital stock relative to others.
- Vulnerability functions for over 50 infrastructure archetypes were developed, including power stations or airports, which connect hazard intensities to expected asset losses in a continuous, qualitative, and probabilistic manner.
- For each asset in the exposure database, the associated damage and losses for each stochastic hazard event was calculated. This enabled the generation of a distribution of potential future losses based on exceedance rates, presenting them as loss exceedance curves and derived financial risk metrics like the average annual loss (AAL).
3. Is GIRI a model or Index?
- GIRI is both a model and an index.
- The Model estimates financial risk metrics such as AAL, providing a measure of the contingent liabilities associated with infrastructure assets.
- The Index offers an operational picture of resilience based on multi-hazard physical risk to infrastructure systems, conditioned by the infrastructure gap and further impacted by various social, economic, and environmental factors.
- The proposed GIRI composite indicator integrates the financial risk metrics from the Model with three different sets of indicators that represent the capacity of a country to resist and absorb, respond, and restore or recover from hazard events. Additionally, the GIRI incorporates an estimated infrastructure gap that accounts for the difference between the infrastructure required to meet the SDGs and the existing infrastructure.
- The GIRI composite indicator has relative values between 0 and 100. The lowest value (0) indicates that infrastructure has low resilience, and the highest value (100) means resilience is high. The figure below shows how the GIRI composite indicator can be disaggregated into the three capacities, each of which, in turn, can be disaggregated into component indicators.
Please note that the GIRI Data Platform focuses on the Risk Model and does not include the Index in the current version.
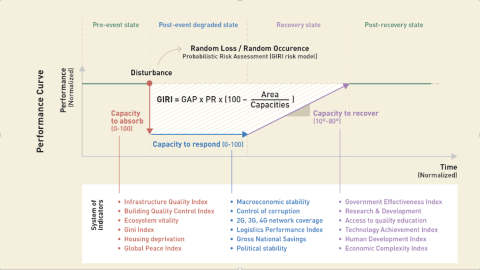
Source: Cardona et al. (2023b)
4. What is Average Annual Loss (AAL), Relative AAL, Probable Maximum Loss (PML), and Loss Exceedance Curve
a) Average Annual Loss
The AAL estimates the contingent liabilities for each infrastructure sector in each country or territory. It is a compact metric with a low sensitivity to uncertainty, corresponding to the expected or average loss that may be experienced in the long run rather than historical loss or losses that will be experienced every year. This is known as the pure risk premium in the insurance industry when normalized by the exposed values. The AAL for any given infrastructure sector and country measures the resources that governments would need to set aside each year to be able to cover asset loss and damage over a long term.
b) Probable Maximum Loss
The PML is a compacted measure related to the loss exceedance annual rate and can be considered as a complementary measure to the AAL, as a benchmark for less frequent losses (i.e., with higher return periods) that can be exceeded in the future.
c) Relative Average Annual Loss
Relative AAL is a ratio of AAL of a particular sector and the aggregate value of its exposure in US$. The metric gives a perspective of disaster damage burden on a particular sector. The formula for Relative AAL is expressed as,
Relative AAL (%) = AAL of the sector in US$/ Exposure of the sector in US$ * 100
d) Loss Exceedance Curve
The central outcome of the GIRI is a national Loss Exceedance Curve (LEC) for each country. It is a metric that represents the annual frequency at that a determined economic loss may be exceeded in the future. Scientific literature recognizes that this curve or the curve deriving from it (the curve of maximum probable losses) is the most robust metric for quantifying catastrophe risk. Metrics such as the AAL and PML are obtained by directly deriving them from the LEC of each country.
5. What type of data sources have supported the development of GIRI?
- GIRI has been developed from open-source databases such as IBTrACS, OpenStreetMap and other WMO’s open-source databases etc. Additionally, GIRI uses some proprietary databases such as MapX.
- Datasets for different hazards were sourced from different globally available sources. For example, for the global flood hazard model, the meteorological datasets used for hydrological simulations were W5E5 and ISIMIP3b.
- The GIRI builds on a long trajectory of development of global risk models over the last 20 -years including the pioneering Global Risk Model (GRM) developed for the United Nations and published in the 2017 edition of the Global Assessment Report on Disaster Risk Reduction (GAR). A full range of references are available at: References | GIRI (unepgrid.ch)
6. Who can use GIRI and how?
- GIRI is a multidisciplinary tool that requires collaboration among various professionals, including risk analysts, GIS specialists, economists, engineers, and decision-makers. By integrating hazard data, exposure information, vulnerability assessments, and financial analyses, GIRI facilitates informed decision-making and risk management strategies at various levels, from local infrastructure planning to national policy development.
- As an example, economic values assigned to each asset in the exposure database to determine the total value of infrastructure assets in each country is valuable input data for economists and financial analysts who use sophisticated methodologies to assess the economic impact of potential hazards and calculate financial risk metrics such as Average Annual Loss (AAL). Similarly, the derived financial risk metrics, such as AAL and loss exceedance curves (LECs), provide valuable information for decision-makers and policymakers to prioritize investments, develop risk mitigation strategies, and formulate policies aimed at reducing vulnerability and enhancing resilience to hazards.
7. How is GIRI different from other open-source probabilistic risk models?
The model is founded in probability theory, allowing a rational and explicit incorporation of uncertainty into the calculation. GIRI is stochastic and relies upon both the physics of the natural phenomena and the randomness of their occurrence. Many thousands of simulations of hazard events have been generated to build up a reasonably exhaustive set of possible consequences for the infrastructure systems under consideration. The model is also non-stationary. Stationarity can be considered true for hazards such as earthquakes. However, incorporating hazards that can be altered by background trends like climate change, implies a non-stationary model. This translates into a collection of time dependent risk metrics. Further, the model has national level resolution while specifically catering to infrastructure sectors’ disaster risk assessments requirements. In addition, it is a fully publicly available data set.
8. What are GIRI’s limitations?
- Although based on well-established risk modelling methodologies, GIRI presents a novel approach to model infrastructure risk and resilience. While the financial risk metrics presented in the report are in the correct order of magnitude, the AAL values are likely to evolve as the model is further calibrated and developed.
- GIRI’s quality will improve as new hazard and exposure data becomes available. As climate change models become more robust, downscaling to local levels becomes more advanced, and the attribution science progresses, more precise data on hydro-meteorological hazards will also become available.
- Vulnerability functions are also likely to improve over time as they are used and tested in different applications.
- Estimating asset risk is critical, given that service disruption and broader systemic impact are normally associated with asset loss and damage. While GIRI improves the understanding and estimation of global infrastructure asset risk and resilience, the costs of service disruption have not been measured and identified even though they are often greater than the cost of asset loss.
- Similarly, the model does not estimate the cost of the wider impact of asset loss and service disruption on productivity, employment, health, education, and poverty.
9. What is the purpose of the GIRI Data Platform?
All the datasets produced by GIRI are available through the interactive and interoperable web GIRI data platform that enables the risk metrics to be displayed, analysed, and shared.
a) What datasets are available on the GIRI platform?
- Geospatial Layers: The Map viewer section of the platform includes 115 geospatial layers, primarily produced by the GIRI consortium (CIMA, INGENIAR, GRID-Geneva, and NGI) for the GIRI project. These layers, along with their metadata, are accessible for display, analysis, and sharing.
- Featured Datasets: Approximately 20 datasets, deemed most representative, are highlighted in a dedicated section called 'Featured'. Users can explore these datasets for specific insights.
- Explore Section: The Explore section provides full access to all available datasets, allowing users to navigate through specific filters based on keywords.
b) How can users analyze data on the GIRI platform?
Within their personalized space (Pinned), users can manipulate the order of layers and incorporate various visual elements such as 3D views, aerial images, and vegetation coverage for analysis. This feature offers flexibility and speed in data exploration.
c) How can users download and share data from the GIRI platform?
- Download: Each dataset produced for GIRI is accessible in Geo Tiff format. Users can download datasets by providing organization name, optional email (for privacy), and purpose of use.
- Share: The platform enables users to share individual or combined layers with customizable options (e.g., predetermined zoom level) across different platforms and social media channels, leveraging the advanced features of the Sharing Manager.
d) How are risk metrics displayed and analyzed on the GIRI platform?
- MapX Integration: MapX is a geospatial data management and visualization platform developed and maintained by UNEP/GRID-Geneva. It serves as the core of the GIRI platform for managing geospatial data. Built on open-source libraries, MapX allows for the interactive display, analysis, and sharing of geospatial data on natural resources. The GIRI platform utilizes the MapX API (Software Development Kit – SDK) to embed MapX in external websites, offering complete customization of data and graphical user interface (GUI).
- Data Display: The Risk Metrics section offers interactive visualization through charts and maps organized into specific dashboards, presenting information such as performance curves, aggregated Average Annual Loss (AAL) per disaster, exposure by building and infrastructure, and key risk measures like AAL, Probable Maximum Loss (PML), and Loss Expectancy Curve (LEC).
- Data Analysis: Users can analyze risk outcomes through sophisticated dashboards, infographics, and filters, facilitating easy understanding and comparison of data across countries.
e) Where can users find additional information on the GIRI platform?
- Layer Metadata: Specific information about each geospatial layer, including metadata following the ISO 19115 standard, is available in the Map viewer section and included in the downloaded data packages.
- Background Papers: The Documentation/Contribution and Background Papers section provides access to essential documents for in-depth understanding of various topics related to the GIRI project, including a search function for quick access to articles and direct links to report.